Archive

Tag Archives: data

Last week, I virtually attended the Knowledge Graph Conference 2020. Originally, KGC was planned to be hosted in New York at Columbia University but, as with everything, had to go online because of the pandemic.

Before getting to the content, I wanted to talk about logistics.  Kudos to Francois Scharffe and the team for putting this conference online quickly and running it so smoothly. Just thinking of all the small things – for example, as a speaker I was asked to do a dry run with the organizers and get comments back for how the presentation went on Zoom. The conference Slack workspace was booming with tons of different challenges. The organizers had a nice cadence of talk announcements while boosting conversation by pushing the Q/A session onto Slack. This meant that the conversations could continue beyond each individual session. At the meta level, they managed to get the intensity of a conference online through the amount of effort in curating those Slack channels along with the rapid fire pace of the talks over the two main track days. Personally, I somehow found this more tiring than F2F because somehow Zoom presentations require full focus to ingest. Additionally, there’s this temptation to do both the conference and your normal workday when the event is in another time zone….which… err.. I might have been guilty of. I also did have some hallway conversations on Slack but not as much as I normally would in a F2F setting.

But what’s the conference about? KGC started last year with the idea of having an application and business oriented event focused on knowledge graphs. I would summarize  the aim is to bring people together to talk about knowledge graph technology in action, see the newest commercially ready tech and get a glimpse of future tech. The conference has the same flavor of Connected Data London . As a researcher, I really enjoy seeing the impact these technologies are having in a myriad of domains.

So what was I doing there? I was talking about Knowledge Graph Maintenance (slides) – how do we integrate machine learning techniques and the work of people to not only create but maintain knowledge graphs. Here’s my talk summarized in one picture:

EXp_fpiWAAAs9GC.jpeg

My goal is to get  organizations who are adopting knowledge graphs to think not only about one-of creation but think about what goes in to keeping that knowledge up-to-date. I also wanted to give a sketch of the current research we’ve been doing in this direction.

There was a lot of content at this event (which will be available online) so I’ll just call out three things I took away from it.

Human Understandable Data

One of the themes that kept coming up was the use of knowledge graphs to help the data in an organization match the conceptualizations that are used within businesses. Sure we can do this by saying we need to build an ontology or logical model or a semantic dictionary but the fundamental point that was highlighted again and again is that this data-to-business bridge was the purpose of building many knowledge graphs. It was kind of summed up in the following two slides from Michael Grove:

cim.png  logicalmodel.png

This also came through in Ora Lassila’s talk (now at Amazon Neptune) as well as the the tutorial I attended by Juan Sequeda about building Enterprise Knowledge Graphs from Relational Databases. Juan ran through a litany of mapping patterns all trying to bridge from data stored for specific applications to human understandable data. I’m looking forward to seeing this tutorial material available.

The Knowledge Scientist 

Given the need to bridge the gap between application data and business level goals, new kinds of knowledge engineering and tools to facilitate that we’re also of interest. Why aren’t existing approaches enough? I think the assumption is that there’s a ton of data that people doing this activity need to deal with.  Both Juan and I discussed the need to recognize these sorts of people – which we call a Knowledge Scientist– and it seemed to resonate or at least the premise behind the term did.

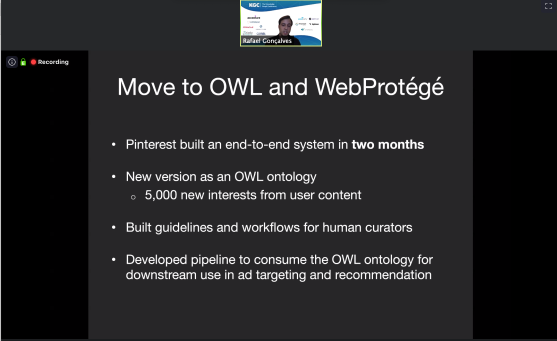
An excellent example of supporting this sort of tools to support knowledge engineering was by Rafael Gonçalves on how Pinterest used WebProtege to update and manage their taxonomy (paper):

pinintereest.png

Likewise, Bryon Jacob discussed about how the first step to getting to a knowledge graph was through the better cataloging of data within the organization. It reminds me of the lesson we learned from linked data – that before we can have knowledge we need to index and catalog the underlying data.  Also, I can never overlook a talk that gives a shoutout to PROV and the need for lineage and provenance 🙂 .

Knowledge Graphs as Data Assets

I really enjoyed seeing all the various kinds of application areas using knowledge graphs. There were early domain adopters  for example in drug discovery and scholarly data that have pushed further in using this technology:

https://twitter.com/azraiekv/status/1258082941315559430

But also new domains like personal health (e.g. deck from Jim Hendler).

https://twitter.com/azraiekv/status/1257802122529312769

The two I liked the most were on law and real estate.  David Kamien fromMind Alliance talked about how knowledge graphs in combination with NLP can specifically help law firms for example by automatically suggesting new business development opportunities by analyzing court dockets.

Ron Bekkerman‘s talk on the real estate knowledge graph that they’ve constructed at Cherre was the most eye opening to me. Technically, it was cool in that are applying geometric deep learning to perform entity resolution to build a massive graph of real estate. I had been at another academic workshop on this only a ~2 weeks prior. But from a business sense, their fundamental asset is that the cleaned data in the form of a knowledge graph. It’s not just data but reliable connected data. Really one to watch.

To wrap-up, the intellectual history of knowledge graphs is long (ee John Sowa’s slides and knowledgegraph.today) but I think it’s nice to see that we are at stage where this technology is being deployed at scale in practice, which brings additional research challenges for folks like me.

Part of the Knowledge Graph of the Knowledge Graph Conference:

kgc.png

Random Notes


Last week, I was at in Malta for a small workshop on building or thinking about the need for observatories for knowledge organization systems (KOSs). Knowledge organization systems are things like taxonomies, classification schemes, ontologies  or concept maps.  The event was hosted by the EU COST action KNOWeSCAPE, which focuses on understanding the dynamics of knowledge through their analysis and importantly visualization.

This was a follow-up to a previous workshop I attended on KOS evolution. Inspired by that workshop, I began to think with my colleague Mike Lauruhn about how the process of constructing KOS is changing with the incorporation of software agents and non-professional contributors (e.g. crowdsourcing). In particular, we wanted to try and get a handle on what a manager of a KOS should think about when dealing with its inevitable evolution especially with the introduction of these new factors. We wrote about this in our article Sources of Change for Modern Knowledge Organization Systems. Knowl. Org. 43(2016)No.8. (preprint).

In my talk (slides below), I presented our article in the context of building large knowledge graphs at Elsevier. The motivating slides were taken from Brad Allen’s keynote from the Dublin Core conference on metadata in the machine age. My aim was to motivate the need for KOS observatories in order to  provide empirical evidence for how to deal with changing KOS.

Both Joseph Tennis and Richard P. Smiraglia gave excellent views on the current state-of-the-art of KOS ontogeny in information systems. In particular, I think the definitional terms introduced by Tennis are useful.  He had the clearest motivation for the need for an observatory – we need to have a central dataset that is collected overtime in order to go beyond case study analysis (e.g. 1 or two KOS) to a population based approach.

I really enjoyed Shenghui Wang‘s talk on her and Rob Koopman’s experiments embeddings to start to try and detect concept drift within journal articles. Roughly put they used different vector spaces for each time duration and were able to see how particular terms changed with respect to other terms in those vector spaces. I’m looking forward to seeing how this work progresses.

2017-02-01 12.20.09 copy.jpg

The workshop was co-organized with the Wikimedia Community Malta so there was good representation from various members of the community. I particular enjoyed meeting John Cummings who is a Wikimedian in Residence at UNESCO. He told me about one of his project to help create high-quality wikipedia pages from UNESCO reports and other open access documents. It’s really cool seeing how deep research based content can be used to expand Wikipedia and the ramifications that has on its evolution. Another Wikipedian Rebecca O’Neill gave a fascinating talk about her rethinking the relationship between citizen curators and traditional memory institutions. Lot’s of stuff at her site so check it out.

Overall, the event confirmed my belief  that there’s lots more that knowledge organization studies can do with respect to large scale knowledge graphs and also those building these graphs can learn from the field.

Random Notes


Next week is the 2015 International Semantic Web Conference. I had the opportunity with the Michel Dumontier to chair a new track on Datasets and Ontologies. A key part of of the Semantic Web has always been shared resources, whether it’s common standards through the W3C or open datasets like those found in the LOD cloud. Indeed, one of the major successes of our community is the availability of these resources.

ISWC over the years has experimented with different ways of highlighting these contributions and bringing them into the scientific literature. For the past couple of years, we have had an evaluation track specifically devoted to reproducibility and evaluation studies. Last year datasets were included to form a larger RDBS track. This year we again have a specific Empirical Studies and Evaluation track along side the Data & Ontologies track.

The reviewers had a tough job for this track. First, it was new so it’s hard to make a standard judgment. Secondly, we asked reviewers not only to review the paper but the resource itself along a number of dimensions. Overall, I think they did a good job. Below you’ll find the resources chosen for presentation at the conference and a brief headline of what to me is interesting about the paper. In the spirt of the track, I link to the resource as well as the paper.

Datasets

  •  Automatic Curation of Clinical Trials Data in LinkedCT by Oktie Hassanzadeh and Renée J Miller (paper) – clinicaltrials.gov published as linked data in an open and queryable. This resource has been around since 2008. I love the fact that they post downtime and other status info on twitter https://twitter.com/linkedct
  • LSQ: Linked SPARQL Queries Dataset by Muhammad Saleem, Muhammad Intizar Ali, Qaiser Mehmood, Aidan Hogan and Axel-Cyrille Ngonga Ngomo (paper). – Query logs are becoming an ever more important resource from everything from search engines to database query optimization. See for example USEWOD. This resource provides queryable versions in SPARQL of the query logs from several major datasets including dbpedia and linked geo data.
  • Provenance-Centered Dataset of Drug-Drug Interactions by Juan Banda, Tobias Kuhn, Nigam Shah and Michel Dumontier (paper) – this resources provides aggregated set of drug-drug interactions coming from 8 different sources. I like how they provided a doi for the bulk download of their datasource as well as spraql endpoint. It also uses nanopublications as the representation format.
  • Semantic Bridges for Biodiversity Science by Natalia Villanueva-Rosales, Nicholas Del Rio, Deana Pennington and Luis Garnica Chavira (paper) – this resource allows biodiversity scientist to work with species distribution models. The interesting thing about this resource is that it not only provides linked data, a spraql endpoint and ontologies but also semantic web services (i.e. SADI) for orchestrating these models.
  • DBpedia Commons: Structured Multimedia Metadata for Wikimedia Commons by Gaurav Vaidya, Dimitris Kontokostas, Magnus Knuth, Jens Lehmann and Sebastian Hellmann  (paper) – this is another chapter in exposing wikimedia content as structured data. This resource provides structured information for the media content in Wikimedia commons. Now you can spraql for all images with a CC-by-sa v2.0 license.

Ontologies

Overall, I think this is a good representation of the plethora of deep datasets and ontologies that the community is creating.  Take a minute and check out these new resources.

coffe from the worldThe rise of Fair Trade food and other products has been amazing over the past 4 years. Indeed, it’s great to see how certification for the origins (and production processes) of products  is becoming both prevalent and expected. For me, it’s nice to know where my morning coffee was grown and indeed knowing that lets me figure out the quality of the coffee (is it single origin or a blend?).

I now think it’s time that we do the same for data. As we work in environments where our data is aggregated from multiple sources and processed along complex digital supply chains, we need the same sort of “fair trade” style certificate for our data. I want to know that my data was grown and nurtured and treated with care and it would be great to have a stamp that lets me understand that with a glance without having to a lot of complex digging.

In a just published commentary in IEEE Internet Computing, I go into a bit more detail about how provenance and linked data technologies are laying the ground work for fair trade data. Take a look and let me know what you think.